How to Invest: Picking Your Funds
A simple index fund approach that has historically performed competitively compared to many actively managed funds

📋 Important: This module is for educational purposes only and does not constitute investment advice, a recommendation, or a guarantee of future results. Past performance is not a guarantee of future performance. Investing involves risk, including possible loss of principal. When I mention specific funds like VTSAX or FSKAX, or vendors like Vanguard and Fidelity, these are educational examples to help you understand the concepts — not personalized recommendations. Always review your vendor's fund options, read prospectuses carefully, and consider consulting a fee-only fiduciary advisor before making investment decisions.
How a PE Teacher Became an Investment Nerd
Before I walk you through the investment options, let me tell you how I figured it out — because if a PE teacher and basketball coach can learn this, so can you.
The book that changed everything for me was The Simple Path to Wealth by JL Collins. I also listened to JL Collins speak on podcasts — including ChooseFI — many times. His message was simple: invest in low-cost index funds, don't try to beat the market, and stay the course. That simplicity resonated deeply with me.
From there, I kept going. David Bach's The Automatic Millionaire taught me the power of automating my savings. Tony Robbins' Money Master the Game and Unshakeable: Your Financial Freedom Playbook gave me a broader perspective on building wealth and the confidence to stay invested no matter what the market does. And dozens of podcast episodes across multiple shows filled in the gaps. (I'll share the full list of podcasts that influenced my journey in Module 10.)
I'm passing everything I learned from hundreds of hours of self-education to you — so you don't have to do that homework yourself.
📊 Before We Start — Let's Talk About the Scoreboard
That subtitle isn't a typo. Over the last 20 years, more than 94% of actively managed mutual funds failed to beat a simple index fund.
That's not my opinion — that's from the SPIVA Scorecard, published by S&P Global (yes, the same company behind the S&P 500). They've been tracking this data since 2002, and the results are consistent: the vast majority of professional mutual fund managers — people with MBAs, billion-dollar research teams, and Bloomberg terminals — can't beat an index fund that charges almost nothing and requires zero expertise.
And here's the part they don't want you to know: nearly half of those funds didn't even survive the full 20 years. They got shut down or quietly merged into other funds to bury the evidence. S&P Global calls this "survivorship bias" — and it means the real failure rate is even worse than it looks.
So what does that mean for you? It means the simple strategy you're about to learn in this module — low-cost index funds — is an approach many educators find accessible and cost-effective. Historically, it has performed competitively compared to many actively managed funds. And you don't need a finance degree to use it.
Source: S&P Dow Jones Indices, SPIVA U.S. Scorecard (2005–2024) — spglobal.com/spdji
📰 The New York Times Experiment (1993–2000)
In 1993, The New York Times invited five mutual fund experts to build hypothetical $50,000 portfolios — designed as lessons for ordinary investors saving for retirement. The experiment was meant to run 20 years, but by 2000, the results were already clear. After seven years — through one of the strongest bull markets in history — the S&P 500 index fund had outperformed the expert-built portfolios. The Times' own headline said it all: "The Winner Is... Indexing." Five professionals, given every advantage, couldn't beat the fund you can buy for almost nothing. This wasn't a fluke — it's the same pattern the SPIVA Scorecard has documented across thousands of fund managers for over 20 years.
Index Funds vs. Actively Managed Mutual Funds
When you log into your 403(b) or 457(b), you're going to see a list of investment options. Most of them will be one of two things: actively managed mutual funds or index funds. Understanding the difference between these two is one of the most important things you'll learn in this entire course.
What is an actively managed mutual fund?
A mutual fund pools money from thousands of investors and hands it to a professional fund manager. That manager's job is to pick which stocks, bonds, or other investments to buy and sell — trying to beat the overall market. You're paying that manager for their expertise through the fund's expense ratio, which typically runs 0.50% to 1.50% per year.
Here's what most people don't realize: these managers are constantly buying and selling. An actively managed mutual fund might turn over 50% to 100% of its holdings every single year. That means by year's end, the manager may have sold and replaced most of the stocks in the fund. Every one of those trades costs money — transaction fees, bid-ask spreads, tax inefficiencies — and those costs get passed directly to you, built into the expense ratio. You never see a bill, but you're paying for every trade.
What is an index fund?
An index fund takes a completely different approach. Instead of paying a manager to pick winners, it simply holds every stock in a specific index — like the S&P 500 (the 500 largest companies in America). No one is deciding which stocks to buy or sell. The fund just mirrors the index.
When a company falls out of the S&P 500, a new one earns its way in — automatically. The fund adjusts, and you don't have to do anything. This is why index fund turnover is typically just 2–5% per year compared to 50–100% for active funds. Fewer trades means lower costs, and expense ratios for index funds are often 0.03% to 0.15% — a fraction of what active funds charge.
Why does this matter for your 403(b), 457(b), and beyond?
Think about it this way: with an actively managed mutual fund, you're paying a professional manager 10 to 50 times more in fees, they're churning through stocks all year generating additional costs, and — as you're about to see — the vast majority of them still can't beat the index fund that just sits there and does nothing.
If you completed Module 4, you already know what fees do to your money over 30 years. Now you know where a big chunk of those fees come from.
And this doesn't just apply to your 403(b) and 457(b). When you open a Roth IRA or invest your HSA (covered in Modules 5 and 6), you'll have even more options available — including individual stocks, actively managed mutual funds, and index funds. The same principle applies everywhere your money is invested. Many financial educators emphasize the same core ideas: keeping costs low, staying broadly diversified, and letting time do the work.
Why Index Funds?
Now that you understand the difference between actively managed mutual funds and index funds, let's go deeper into how index funds actually work — because the more you understand them, the more confident you'll feel about your investment choices.
Think of It Like a Basket of Stocks
I like to think of an index fund as a basket. Instead of buying one company's stock and hoping it takes off, you're buying a basket that holds a tiny piece of hundreds — sometimes thousands — of companies all at once.
For example, an S&P 500 index fund holds all 500 of the largest companies in America. Apple. Google. Johnson & Johnson. Walmart. You own a slice of all of them with a single fund. One basket. Instant diversification. No guesswork.
The Basket Is Self-Cleansing
Here's the part that really got me when I first learned it — and it's something most people never hear about.
Index funds don't just sit still. They automatically update themselves. When a company starts underperforming and drops out of the index, it gets removed from your basket and replaced by a stronger company moving up. You never have to do a thing — the index itself handles it.
Think about what that means: the index tends to reflect the largest and most successful companies at any given time. Underperformers are replaced as the composition changes. New rising companies earn their way in. Your basket is constantly upgrading itself — completely automatically, at no extra cost to you.
Compare that to trying to pick individual stocks — choosing which companies will win, which will lose, and when to buy or sell. It's stressful, time-consuming, and the odds are against you. The basket removes all of that. You stop trying to guess and just own the whole game.
You Found A Green Light Vendor. Now What?
In Module 4, you learned about fees and discovered 403bwise. You looked up your district, found the green light vendors, and now you're ready to open an account.
But here's where most teachers get stuck: "What do I actually invest in?"
You log into Vanguard or Fidelity, and suddenly you're staring at 50+ investment options with names like:
- "Vanguard Total Stock Market Index Fund"
- "Fidelity 500 Index Fund"
- "Target Date 2055 Fund"
- "Bond Index Fund"
📌 Note: Fidelity and Vanguard are used throughout this module as examples because they're among the most widely available low-cost providers. Many other low-cost providers offer similar funds. Always check your district's approved vendor list to see what's available to you.
This module breaks it all down — what these options actually are, three simple approaches many educators use, and the historical data that informed my own decision to keep it simple.
📖 Quick Vocab: The Language of Investing
Before we dive in, let's get comfortable with the words you'll see throughout this module — and inside every retirement account you'll ever open. Master these, and the rest of this module clicks into place.
Shares
When you invest in a fund, you're buying tiny pieces of ownership called shares. Think of it like a pizza cut into a million slices — each slice is a share. When you contribute $200/month to your 403(b), that money buys however many slices the current price allows.
When prices drop, your $200 buys more slices. When prices rise, it buys fewer slices — but the ones you already own are worth more. Over time, consistent monthly contributions mean you're always buying — whether prices are high or low. This is called dollar cost averaging, and historically it has worked in long-term investors' favor.
Stocks & Bonds
Two more words you'll see throughout this module — and throughout your retirement accounts. Here's the plain-English version:
A stock is a tiny piece of ownership in a company. When you buy a stock, you own a small slice of that business — its profits, its growth, and yes, its losses. If the company does well, your stock goes up in value. If it struggles, it goes down. Stocks have historically offered higher long-term growth, but with more ups and downs along the way.
A bond is a loan you make to a company or the government. They pay you back with interest over a set period — like an IOU with a guaranteed payment schedule. Bonds are generally considered more stable than stocks, but with lower long-term growth potential.
As JL Collins puts it in The Simple Path to Wealth, bonds are there to "smooth the waters." Stocks are the engine that drives growth — bonds keep the ride from making you seasick.
Why does this matter? Every fund you'll see in your 403(b) or 457(b) is made up of stocks, bonds, or a mix of both. Understanding the difference helps you make sense of the three investment paths coming up — and why the mix between stocks and bonds changes as you get closer to retirement.
Ticker Symbols
Throughout this module you'll see letters like VTSAX and FSKAX — these are called ticker symbols. Every investment fund has a unique one, kind of like a license plate for a car. It's just a shorthand code that identifies a specific fund. When you search for a fund in your retirement account, you can type the ticker symbol to find it instantly.
The ticker symbols in this module are from Vanguard and Fidelity — two of the most popular low-cost vendors. If your district uses a different vendor, your ticker symbols will be different, but the funds will be similar. Just search for "total stock market," "total international," and "total bond market" within your vendor's fund list. The names may vary slightly, but the concept is the same.
Three Simple Paths to Choose From
I want to be upfront with you — there are countless investing philosophies out there. Entire books, podcasts, and YouTube channels dedicated to different strategies. It's simply not possible to cover all of them in one course, and honestly, that would do more harm than good. Too many options leads to paralysis, and paralysis leads to doing nothing.
So instead of giving you everything, I'm sharing three straightforward approaches built around low-cost index funds. They aren't flashy or complicated — but that's the point. They're practical, they're backed by data, and many educators have stuck with them for the long haul. See which one resonates with your situation:
They're ordered from simplest (least ongoing decisions) to most hands-on (more funds to manage and rebalance). All three are legitimate approaches — the right choice depends on how involved you want to be.
Path 1: Set and Forget
Want complete autopilot? Never think about investing again? A Target Date Fund is often called the 'easy button.' Many teachers (including me when I first started) find this the simplest path — because it requires zero ongoing decisions after setup.
Path 2: Simple & Aggressive
Under 40 and interested in maximum growth? Many long-term investors in this position choose an All Stocks approach.
Path 3: Traditional Balanced
Want control with bonds for stability? Build a 3-Fund Portfolio.
Let's break down each path so you can decide which fits you best. 👇
Path 1: Target Date Funds (The Easy Button)
One of the simplest approaches is a Target Date Fund.
How they work:
- Educators often select the fund closest to when they expect to need the money — for most teachers that's somewhere between 58 and 67, depending on your pension, health coverage, and when you plan to draw from this account
- The fund automatically adjusts from stocks to bonds as you age
- You never have to rebalance or make changes
But What's Actually Inside a Target Date Fund?
It's not some mysterious Wall Street creation. When you open one up, here's what you'll find — just three types of index funds bundled together:
- A Total U.S. Stock Market Fund — owns thousands of American companies
- An International Stock Fund — owns companies outside the U.S.
- A Bond Fund — provides stability and income
These three make up the vast majority of most target date funds — and in some cases, they're the only holdings. Some funds may also include smaller positions in TIPS, REITs, or emerging market funds, but the core is almost always U.S. stocks, international stocks, and bonds.
That's it. Three ingredients. The "target date" part is just how the fund company blends them over time — heavy on stocks when you're young, gradually shifting toward bonds as you approach retirement. This is called a glide path:
Example Target Date Funds
| Your Age | Retirement Year | Common Funds to Consider by Approximate Retirement Year |
|---|---|---|
| 25 | 2062 | Target Date 2060 or 2065 Fund |
| 35 | 2052 | Target Date 2050 or 2055 Fund |
| 45 | 2042 | Target Date 2040 or 2045 Fund |
| 50 | 2037 | Target Date 2035 or 2040 Fund |
| 55 | 2032 | Target Date 2030 or 2035 Fund |
Want to be more aggressive? Some educators select a fund 5-10 years beyond their retirement date (e.g., retiring in 2045? Consider the 2055 fund for more stocks longer).
Want to be more conservative? Some educators select a fund 5-10 years before their retirement date (e.g., retiring in 2045? Consider the 2035 fund for an earlier shift to bonds).
We all have a different investment tolerance. A teacher who can sleep through a 30% market drop might pick the later fund. A teacher who checks their balance every week and gets anxious might pick the earlier one. Neither is wrong — it's about what keeps you invested and not panic-selling. Just keep in mind: selecting a fund significantly different from your actual retirement year changes your risk exposure as you approach retirement — make sure your tolerance for market swings will still match the fund's allocation in 5-10 years.
✅ When Educators Often Consider a Target Date Fund
Educators who value maximum simplicity often select a Target Date Fund when they:
- Want the simplest approach possible
- Don't want to think about rebalancing
- Are okay with "good enough" instead of optimizing every detail
- Want to set it and forget it
At Vanguard: Look for "Target Retirement 20XX" funds (fees around 0.08%)
At Fidelity: Look for "Fidelity Freedom Index 20XX" funds (fees around 0.12%)
⚠️ Critical: Look for the word "Index"
Many providers offer two versions of their target date funds — an indexed version and an actively managed version. The difference in fees can be significant. For example, at Fidelity (mentioned as an educational example, not an endorsement): the Freedom Index 2050 fund charges around 0.12%, while the Freedom 2050 fund (actively managed) charges around 0.68%. That is more than half a percent difference — on a $500K balance, that could mean roughly $2,800/year more in fees. Many educators look for the word "Index" in the fund name.
Path 2: All Stocks Portfolio
One aggressive, growth-oriented approach is 100% stocks:
- 100% stocks, 0% bonds
- Just 1-2 funds to manage
- Maximum growth potential
- You can always add bonds later as you approach retirement
Two Ways to Do All Stocks
🚀 Option A: Single Fund (Easiest)
What it does: Owns ~4,000 U.S. companies - instant diversification
Fees: 0.03-0.04% (ultra-low)
🌎 Option B: Two Funds (Global Diversification)
What it does: Owns companies in Europe, Asia, emerging markets
Why: Hedge against U.S.-only risk, capture global growth
⚖️ You Choose the Split
The 70/30 split shown here is one common starting point — but you choose the weight. Many educators go 80/20 (more U.S. focused), 60/40 (60% U.S. / 40% international), or even 50/50. There's no single right answer. The key is picking a split you're comfortable with and staying consistent.
When you log into your vendor's website and select your funds, you'll see a field to enter the percentage for each fund — just make sure they add up to 100%. For example: 70% in the U.S. fund, 30% in the international fund. You can adjust this at any time.
✅ When Some Younger Educators Consider an All-Stocks Approach
Some younger educators with long time horizons and high comfort with market swings consider an All-Stocks approach when they:
- Are under 40 years old (25+ years to retirement)
- Can stomach 30-50% drops without losing sleep (or at least without selling)
- Want to prioritize long-term growth potential
- Believe in the stock market's long-term trajectory
- Don't need bonds to sleep at night
This approach may not suit educators who: are within 10 years of retirement, or who prefer less volatility in their portfolio.
Path 3: The 3-Fund Portfolio (Traditional Balanced)
For educators who like having a little more control over the dials, the 3-Fund Portfolio is worth understanding. It’s exactly what it sounds like — just three funds.
This is called the "3-Fund Portfolio" and it's a strategy popularized by investing legends like Jack Bogle (founder of Vanguard).
The Three Funds
🏗️ The 3-Fund Portfolio
What it does: Owns ~4,000 U.S. companies
Example allocation range: 50-70% of portfolio (based on age)
What it does: Owns companies in Europe, Asia, emerging markets
Example allocation range: 10-30% of portfolio
What it does: Owns U.S. government and corporate bonds
Example allocation range: Based on your age (increases as you age)
Sample Portfolios by Age
| Age Range | U.S. Stocks | International Stocks | Bonds |
|---|---|---|---|
| 25-35 | 60% | 25% | 15% |
| 35-45 | 50% | 25% | 25% |
| 45-55 | 45% | 20% | 35% |
| 55-65 | 35% | 15% | 50% |
✅ When Educators Often Consider a 3-Fund Portfolio
Educators who prefer slightly lower fees and are willing to spend 10–15 minutes once a year often build a 3-Fund Portfolio when they:
- Want slightly lower fees than Target Date Funds (0.03-0.05% vs 0.08-0.12%)
- Are willing to rebalance once per year — it takes 10–15 minutes, literally set a calendar reminder for your birthday
- Want bonds for stability and sleep-at-night factor
- Like the traditional balanced approach
The tradeoff: Slightly lower fees than a Target Date Fund (typically by approximately 0.04-0.08% annually), but requires about 15 minutes of work each year to rebalance.
Making Your Decision
Here's a framework many educators use when considering their options:
🎯 Quick Decision Guide
If no: Continue to Step 2.
If no: Continue to Step 3.
If no: A Target Date Fund (Step 1) may be a better fit.
Wondering how contributions affect your take-home pay? Try the Paycheck Impact Calculator to see exactly how much your paycheck changes after taxes.
This is an educational illustration only. Your own situation, risk comfort, and vendor options will determine what fits you best.
Example Teacher Scenarios
📖 Rachel's Simple Approach (Target Date)
Rachel is 32, teaches elementary school, and doesn't want to think about investing. She chose Vanguard Target Retirement 2055 Fund and set up automatic contributions of $400/month.
That's it. She doesn't check her balance monthly. She doesn't worry about the market. She knows the fund automatically shifts from stocks to bonds as she ages.
In this hypothetical scenario, her contributions could grow to approximately $620,000 — though actual results will vary and are not guaranteed.
Assumes $400/month at 7% average annual return, compounded monthly over 33 years to age 65.
📖 Marcus's All Stocks Approach
Marcus is 28 and just started teaching. He went with 100% Vanguard Total Stock Market — nothing else. No bonds, no complexity.
When the market drops, he doesn't panic. He knows he has 37 years until retirement. Market crashes are buying opportunities for him.
His fees: 0.03% per year. His strategy: max growth while he's young, add bonds in his 50s.
📖 David's 3-Fund Portfolio
David is 45 and likes having more control. He set up a 3-fund portfolio at Fidelity:
- 50% Fidelity Total Market Index (U.S. stocks)
- 20% Fidelity International Index (International stocks)
- 30% Fidelity U.S. Bond Index (Bonds)
Once per year, he checks if any fund has drifted more than 5% from target. If so, he rebalances. Takes him about 15 minutes annually.
His total fees: 0.04% per year. Over 20 years, the fee difference could hypothetically amount to a few thousand dollars compared to a target date fund — but he has to do that annual rebalancing.
The Snowball Effect: How Compound Interest Actually Works
Compound interest is the single most important force working in your favor when you invest for retirement. Money in a retirement account doesn't just grow — it grows on top of its own growth.
Let me break it down simply. Say you invest $1,000 and it earns 7% in a year. You now have $1,070. The next year, you earn 7% again — but not on your original $1,000. You earn it on the full $1,070. So you gain $74.90 instead of $70. The year after that, you earn 7% on $1,144.90. And so on.
That extra bit each year doesn't sound like much. But over 30 or 40 years, the "interest on interest" part takes over and becomes far bigger than what you originally put in. That's why time is more valuable than any other single factor in retirement investing — more than how much you earn, more than the exact fund you pick, more than any market timing trick.
The Snowball Analogy (one of my favorites)
Before I retired, I loved using the snowball analogy to help my students understand how investing really works. It's simple, but it sticks. When you start rolling a snowball down a hill, it may feel small and slow at first—almost like nothing is happening. But if you keep it moving, it begins to gather more snow, grow a little faster, and eventually turn into something much bigger than you expected.
I didn't get serious about investing until I was 52, so I definitely wasn't starting at the top of the hill. But that's the point—it didn't matter. What mattered most was that I started.
This animation is a hypothetical illustration for educational purposes only. It assumes a 7% average annual return, compounded monthly — roughly in line with long-term historical stock market averages, though actual returns vary significantly year to year. This is not a guarantee or prediction of future performance.
📈 Now Run Your Own Numbers
The snowball gave you the concept. The calculator gives you the specifics — your contribution, your timeline, your result.
Try the Compound Interest Calculator →The Most Important Lesson: Stay the Course
You've picked your funds. You've set up automatic contributions. Now here's the hardest part of investing — and it has nothing to do with picking the right fund.
It's not selling when the market drops.
The stock market will go down. Sometimes it will go down a lot. When your account drops 20%, 30%, even 40%, many investors feel a strong instinct to sell and protect what's left. Historical market data suggests that staying invested through downturns has often been a more effective long-term approach. JL Collins explains this beautifully in The Simple Path to Wealth — the market has always had ups and downs, but historically there have been far more ups than downs. His core message — and a principle I strongly believe in: stay the course and maintain consistency through market cycles.
But don't just take my word for it. Let me show you the data that convinced me.
What Is Dollar Cost Averaging?
Dollar cost averaging means investing a fixed amount of money on a regular schedule — regardless of what the market is doing. When you set up automatic contributions from your paycheck into your 403(b), you're already doing it.
Here's why it's so powerful: when the market is up, your fixed contribution buys fewer shares (they're expensive). When the market is down, that same contribution buys MORE shares (they're on sale). Over time, you end up buying more shares at low prices than at high prices — which lowers your average cost and increases your returns.
Historically, many long-term investors have continued investing through market downturns — viewing lower prices as an opportunity, not a threat. Every contribution during a downturn purchases shares at reduced prices. And when markets have recovered — as they historically have — those shares purchased at lower prices have been worth significantly more.
The "Lost Decade" — And Why It Doesn't Matter
From January 1, 2000 to December 31, 2009, the S&P 500 produced negative total returns. A full decade. The dot-com bubble burst (2000-2002). Then the financial crisis hit (2008-2009). Investors who bought on January 1, 2000 and checked their balance on December 31, 2009 saw a total loss of roughly 9-10% — an annualized return of negative 0.9%.
Sounds terrifying, right? But here's what the headlines miss: teachers who kept contributing through those 10 years came out ahead. Their automatic contributions bought shares at rock-bottom prices during both crashes. When the market recovered — and it did, spectacularly — those cheap shares multiplied in value. Dollar cost averaging turned the "Lost Decade" into a wealth-building opportunity.
The Ultimate Proof: The Great Depression
I was watching The Money Guy Show podcast on my TV one night when I saw something so powerful, I had to rewind it and take a screenshot with my phone. You can even see the reflection of my living room in the image — that's how real this moment was for me. It's the piece of data that convinced me personally about dollar cost averaging:
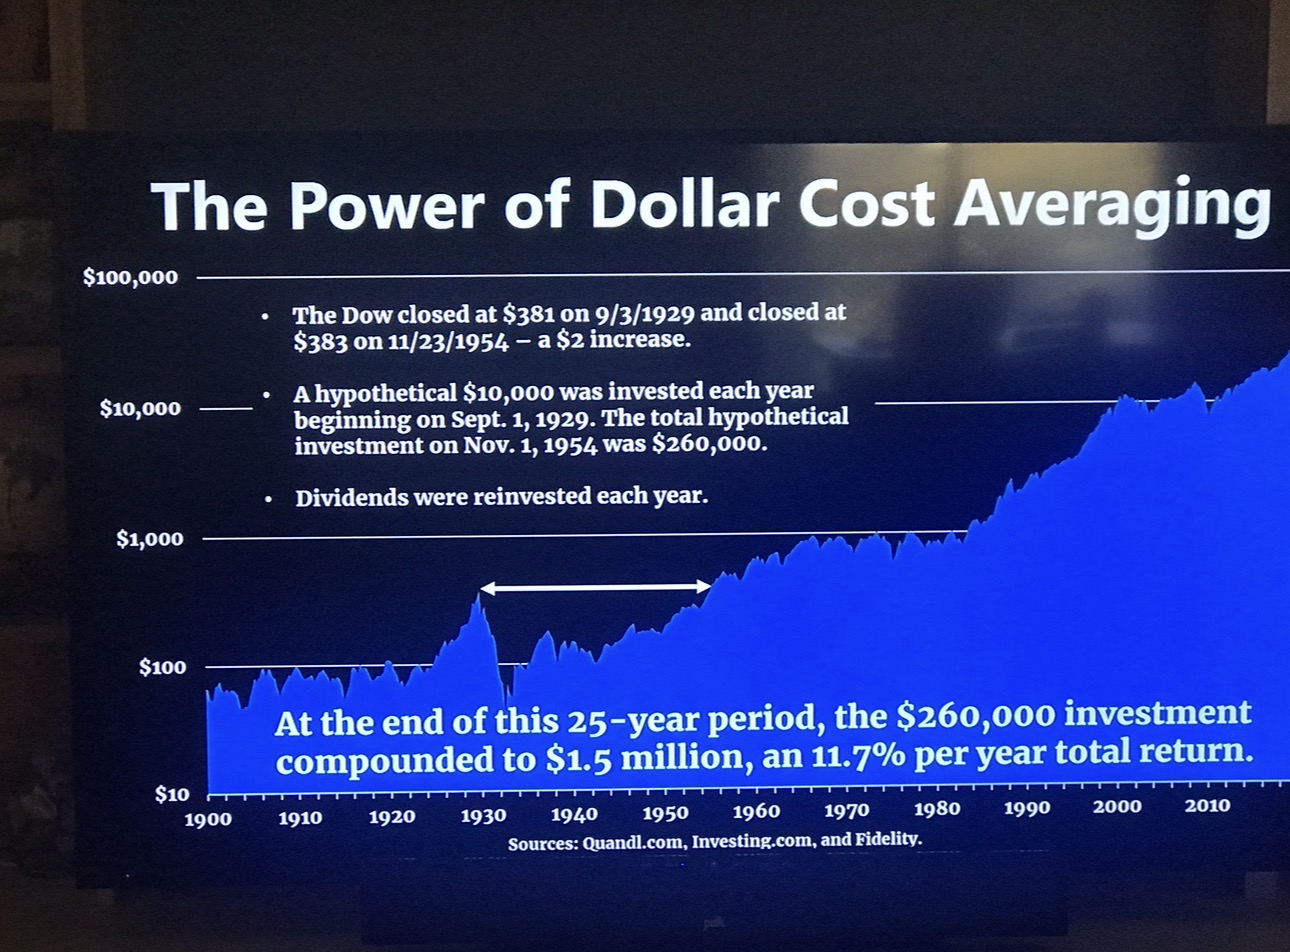
Source: The Money Guy Show (Quandl.com, Investing.com, and Fidelity)
Read that again. The Dow closed at $381 on September 3, 1929 — the eve of the Great Depression. It didn't get back to that level until November 23, 1954, when it closed at $383. A $2 increase over 25 years.
If you invested a lump sum on the worst possible day in market history and just held it, you waited a quarter century to break even. That's the scary headline.
But here's the headline that changes everything: If you invested $10,000 every year starting September 1, 1929 — through the Great Depression, through World War II, through every crisis of those 25 years — your total investment of $260,000 compounded to $1.5 million. That's an 11.7% annualized return. During the worst economic period in American history.
This illustrates the potential benefit of dollar cost averaging, maintaining consistency through market cycles, and staying the course.
But What About Market Timing?
Before I show you the next piece of data, let me explain something you'll hear a lot once you start investing: "timing the market."
What is market timing? It's the idea of trying to predict when the stock market will go up or down — and buying or selling based on those predictions. "I'll wait until the market drops to invest." "I'll sell before it crashes." "I'll jump back in when things recover." That's market timing.
It sounds logical. Buy low, sell high — who wouldn't want to do that? But here's the problem: nobody can do it consistently. Not Wall Street professionals. Not billionaire hedge fund managers. Not the talking heads on financial news shows. Study after study has shown that even the "experts" fail at timing the market more often than they succeed. And every day you sit on the sidelines waiting for the "right time" is a day your money isn't growing.
So what do many long-term investors do instead? One commonly used approach is dollar cost averaging — investing a fixed amount on a regular schedule regardless of market conditions. If you're making automatic 403(b) contributions from your paycheck, you're already doing it.
And if you're not convinced yet, this next piece of data is the one that sealed it for me. It comes from Tony Robbins' Unshakeable: Your Financial Freedom Playbook — another book I highly recommend — and it shows a study by Schwab looking at what happened when someone invested $2,000 per year for 20 years starting in 1993, using three different approaches:
The Schwab Timing Study
$2,000 invested per year for 20 years (1993–2012)
| Strategy | Final Value |
|---|---|
| 🎯 Perfect Timing — invested at the best moment every year | $87,004 |
| 😬 Worst Timing — invested at the worst moment every year | $72,487 |
| 💵 Stayed in Cash — never invested (Treasury Bills only) | $51,291 |
Source: Charles Schwab data (Riepe, 2013), referenced in Tony Robbins' Unshakeable
The person with perfect timing — who somehow invested at the absolute best moment every single year — ended up with $87,004. The person with the worst timing — who invested at the absolute worst moment every year, every single time — ended up with $72,487. That's only a 17% difference between perfect and terrible timing.
But the person who stayed in cash (Treasury Bills) and avoided the market entirely? Just $51,291. Even the unluckiest investor alive beat the person who never invested at all.
When your 403(b) drops 30% and your colleagues are panicking in the break room, remember this module. Remember the teacher who invested $10,000 a year through the Great Depression and ended up a millionaire. Your automatic paycheck contributions are doing the exact same thing. Stay the course. Keep investing. Many long-term investors have found that consistency through market cycles is what matters most.
As The Money Guy Show says — and as JL Collins wrote — time in the market beats timing the market — and that’s not just a saying, it’s backed by decades of data.